7 Financial Metrics for Selling iGaming Businesses

7 Financial Metrics for Selling iGaming Businesses
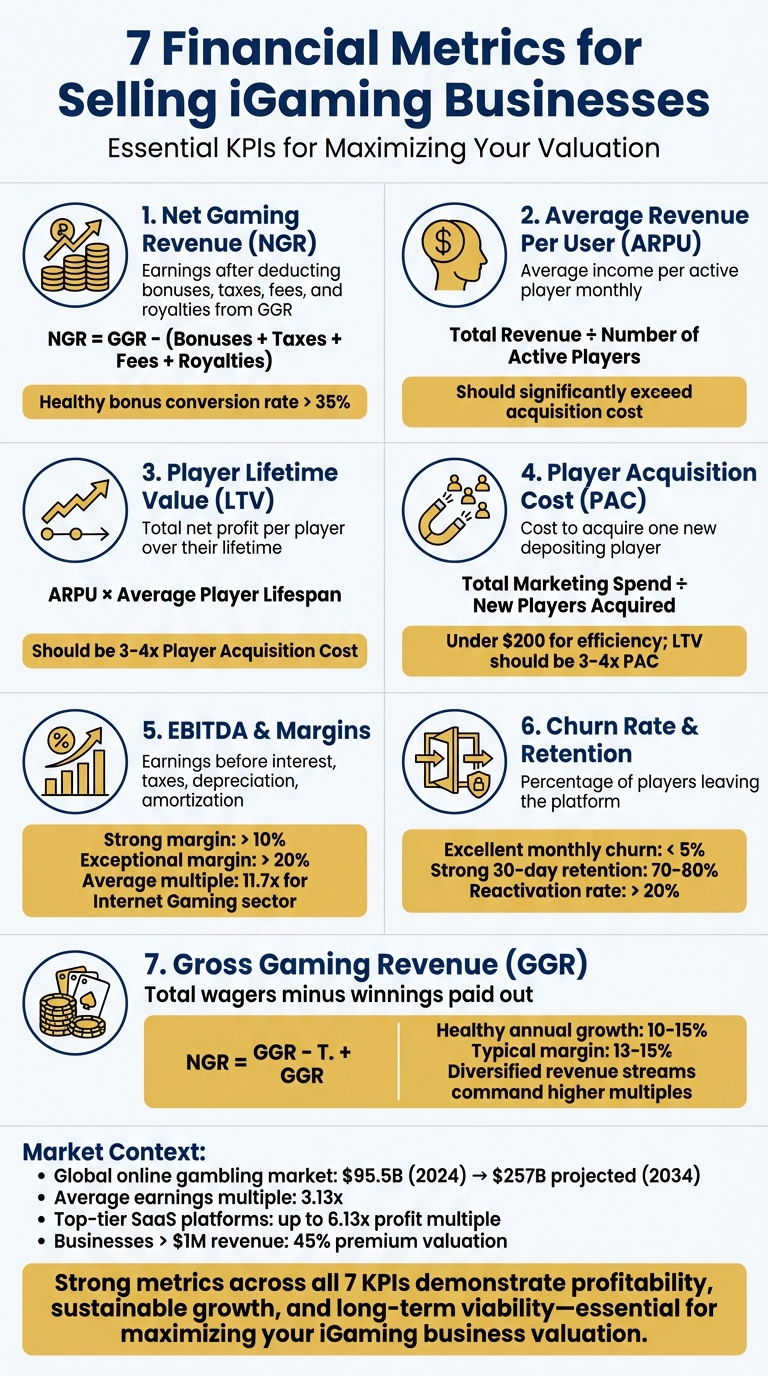
When selling an iGaming business, financial metrics are essential to accurately assess its value and appeal to buyers. Here are the seven key metrics you need to focus on:
- Net Gaming Revenue (NGR): This measures profitability after deducting expenses like bonuses, taxes, and fees. Buyers use NGR to evaluate operational efficiency and revenue retention.
- Average Revenue Per User (ARPU): Tracks how much revenue each active player generates. A higher ARPU signals better monetization and player engagement.
- Player Lifetime Value (LTV): Shows the total profit a player contributes over their time with your platform. A strong LTV indicates business stability and effective retention strategies.
- Player Acquisition Cost (PAC): The cost of acquiring a new player. A healthy LTV-to-PAC ratio (3-4x) demonstrates profitability and sustainable growth.
- EBITDA and Margins: EBITDA highlights core profitability, while margins (10%+ is strong) reflect operational efficiency. Buyers often base valuations on EBITDA multiples.
- Churn Rate and Retention: Low churn (below 5%) and high retention (70-80% over 30 days) indicate a loyal player base and predictable revenue streams.
- Gross Gaming Revenue (GGR): Represents total wagers minus winnings. Diverse and steady GGR growth (10-15% annually) enhances appeal.
Quick Overview
- Metrics like NGR, ARPU, and LTV show profitability and player value.
- PAC and churn rate reveal acquisition efficiency and retention strength.
- EBITDA and GGR provide a snapshot of financial health and revenue diversity.
- Buyers prioritize businesses with strong ratios, predictable revenue, and clear financial records.
These metrics not only boost valuation but also give potential buyers confidence in the long-term viability of your business.
1. Net Gaming Revenue (NGR)
Definition and Calculation Method
Net Gaming Revenue (NGR) represents the earnings a business retains after deducting direct costs like bonuses, taxes, fees, and royalties from the Gross Gaming Revenue (GGR). While GGR reflects total bets minus total wins, NGR digs deeper, accounting for the actual operating expenses.
The calculation is simple:
NGR = GGR – (Bonuses + Taxes + Payment Fees + Licensing Fees + Chargebacks + Royalties) [11][12][17].
For example, imagine a casino with $1,000,000 in GGR. If it spends $200,000 on welcome bonuses, $150,000 on gaming taxes, $50,000 on payment processing fees, and $100,000 on royalties, the NGR would amount to $500,000. This figure provides a more accurate measure of financial performance than GGR alone.
Why It Matters for Valuation
NGR is a critical metric when assessing the value of an iGaming business. Unlike GGR, which only captures top-line activity, NGR offers insights into the company's actual profitability. As Mateo, an iGaming content creator at Affnook, puts it:
"NGR is more than just a financial metric - it's a window into the health and profitability of an iGaming business" [11].
The NGR-to-deposit ratio is especially useful, as it shows how effectively player deposits are converted into retained revenue [12][15]. A high ratio signals operational efficiency, while a low ratio may indicate overspending on promotions or poor cost management. Businesses with strong NGR figures are better positioned to attract potential buyers.
Optimization Strategies
Improving NGR is key to boosting the value of your business. To achieve this, consider these strategies:
- Reduce bonus abuse: Use clear terms and multi-level reward structures to prevent exploitation. A bonus conversion rate above 35% is considered healthy, while anything below 20% might suggest unclear requirements or abuse by bonus hunters [4].
- Expand your product mix: Adding new games or services can increase GGR without significantly raising costs [11][17].
- Streamline payment processing: Consolidate fees from multiple game providers through aggregators to lower royalty expenses. Offering diverse payment options - like e-wallets, cryptocurrencies, and credit cards - can also minimize deposit abandonment [15][17].
- Control chargebacks and fraud: Keep chargeback rates between 0.1% and 1% and fraud detection rates between 0.2% and 1.5% to protect your NGR [4].
Buyer Perspective
For buyers, NGR is the ultimate indicator of a business's operational revenue. Najam Ahmed from Comm100 explains:
"This is your actual revenue, stripped of fluff. Focus on this number for a realistic view of financial performance" [4].
During due diligence, buyers will scrutinize which costs are factored into your NGR calculation. Standardizing definitions - such as those for jackpot contributions and provider fees - helps avoid misunderstandings [14]. Additionally, automated reconciliation processes that integrate data from payment gateways and game providers can enhance buyer confidence in the accuracy of your NGR figures [13].
Since many jurisdictions base tax obligations on NGR, demonstrating compliance and a stable tax environment can make your business more appealing [11]. By presenting clear, reliable NGR metrics, you not only strengthen buyer trust but also lay the groundwork for a solid valuation.
2. Average Revenue Per User (ARPU)
Definition and Calculation Method
Average Revenue Per User (ARPU) gauges the average income generated from each active player within a specific timeframe, often calculated monthly. The formula is straightforward: divide the Total Revenue by the Number of Active Players [4]. In the iGaming world, operators typically rely on Gross Gaming Revenue (GGR) to calculate ARPU, though some may opt for Net Gaming Revenue (NGR) for a clearer picture of profitability.
For instance, if your platform earns $500,000 in revenue from 10,000 active players in a month, the ARPU would be $50.
Why It Matters for Valuation
ARPU is a key metric for understanding how revenue growth is achieved - whether it's through acquiring more users or increasing the value derived from existing ones [1]. A rising ARPU indicates that players perceive greater value, which directly enhances your platform's appeal to potential buyers. As Comm100 puts it:
"ARPU helps you understand the average revenue generated per active player, offering a snapshot of overall monetization performance" [4].
When ARPU significantly surpasses the cost of acquiring users, it signals a sustainable and profitable business. Buyers often analyze ARPU trends alongside user segmentation. For example, a small but influential group of "Whales" - those high-spending players who typically make up 1–3% of users - can contribute over 50% of in-app purchase revenue [20].
Optimization Strategies
Improving ARPU before a sale can significantly boost your platform's valuation. Here are some effective strategies:
- Upselling and Cross-Selling: Introduce premium features like VIP memberships, which can generate 3–5 times the revenue of an average user [1][20].
- Personalization: Use data analytics to tailor offers and content to user behavior. Personalized bonuses and limited-time deals can increase lifetime value by 50–70% [5]. Event-based promotions during holidays can also drive revenue spikes of 40–60% [20].
- Audience Segmentation: Identify underperforming user groups and craft targeted monetization strategies to improve their spending [4].
- Enhancing User Experience: Regularly update your game portfolio and refine the user interface to reduce bounce rates, extend playtime, and encourage higher spending [22].
Buyer Perspective
A high ARPU suggests strong product-market alignment and quality traffic, making your platform a more attractive investment [2]. Serge Abramov, a professional media buyer, emphasizes the importance of ARPU in the iGaming space:
"As far as I know, ARPU and ARPPU are especially widespread metrics for mobile apps. So you definitely should consider those if you work with an iGaming app" [10].
Buyers carefully evaluate ARPU trends and compare them with Average Revenue Per Paying User (ARPPU) to assess the loyalty and spending habits of your user base [10]. A healthy platform generally aims for a Player Lifetime Value that is three to four times the cost of acquiring a user [10].
3. Player Lifetime Value (LTV)
Definition and Calculation Method
Player Lifetime Value (LTV) represents the total net profit a single player is expected to generate throughout their time on your platform [23][24][25]. The formula to calculate it is straightforward:
LTV = Average Revenue Per User (ARPU) × Average Player Lifespan (ALP)
Alternatively, a more detailed version accounts for costs:
LTV = (ARPU × ALP) - Acquisition and Retention Costs [23][26].
For example, if your platform earns $150 per player each month and the average player stays active for 18 months, the basic LTV would be $2,700. But if acquiring that player costs $500 and retaining them costs another $300, the actual LTV drops to $1,900. Advanced operators often use tools like cohort analysis and AI to predict player value based on early behavior patterns [24][26].
Why It Matters for Valuation
LTV is a key indicator of business health, showing that your revenue isn’t just based on one-off transactions but is instead steady and reliable. A high LTV signals strong player relationships and business stability - qualities that buyers find attractive. As Lusane Jalalyan from BetConstruct puts it:
"LTV is an excellent indicator of your business growth potential and the overall quality of the relationship between you and your player." [25]
A solid iGaming business generally aims for an LTV that is three to four times the Player Acquisition Cost. Interestingly, the top 5% of players often generate between 60% and 80% of total revenue [27][28]. These metrics highlight efficient marketing and underscore the long-term value of your player base.
Optimization Strategies
Boosting player retention by even 5% can lead to profit increases of 25% to 95% [27]. To achieve this, consider segmenting your player base into groups like VIPs, casual players, bonus hunters, and dormant users. This allows you to customize your marketing strategies for each segment [25][26].
Keep your content fresh by offering market-specific games to maintain player interest [25][28]. Tiered loyalty programs with perks like exclusive rewards or dedicated account managers can also enhance retention for high-value players [26][29]. Additionally, ensure your platform is optimized for mobile and maintains 99.9% uptime, as most players now access services via their phones [27][29]. Fast and efficient customer support is another priority - aim for live chat response times of under 30 seconds to keep players satisfied [4]. These efforts not only improve retention but also demonstrate a stable and scalable revenue model, which is crucial for attracting buyers.
Buyer Perspective
When evaluating a business, buyers closely analyze LTV across different acquisition channels, as each channel brings in players with varying levels of value [28]. For example, players acquired through SEO often have higher LTVs compared to those from PPC or bonus-heavy affiliate campaigns. This is because SEO-acquired players tend to be more loyal and organic [24][28].
Ideally, LTV should be three to four times the acquisition cost [27]. Buyers also look for a monthly churn rate below 5% to ensure the player base is stable [4][27]. Businesses that rely on structured, data-driven decision-making report an average revenue growth of 9.6%, compared to just 0.9% for less data-focused companies [27]. Presenting strong LTV metrics backed by robust data reassures buyers of your business’s potential for long-term growth and profitability.
4. Player Acquisition Cost (PAC)
Definition and Calculation Method
Player Acquisition Cost (PAC) refers to how much it costs to bring in a single new depositing player. The formula is simple:
PAC = Total Marketing and Sales Spend / Number of New Players Acquired [4].
The "total spend" includes everything from advertising and affiliate commissions (which usually range between 20%–40% of revenue) to salaries, creative production, and CRM tools [32,36]. The cost can vary significantly depending on the type of player. For instance, acquiring slot players typically costs between $100 and $200, while poker players may cost between $400 and $600. Knowing your PAC is crucial to understanding how it impacts your overall profitability.
Why It Matters for Valuation
PAC is a critical metric for evaluating whether your business is profitable or losing money. As Najam Ahmed from Comm100 explains:
"If [PAC] is higher than your average LTV, you're burning cash" [4].
Investors and buyers often examine the LTV-to-PAC ratio to assess the business's long-term sustainability. A healthy iGaming company usually maintains an LTV that’s at least three to four times higher than its PAC [4,7]. For many, a PAC under $200 is considered efficient for achieving profitability goals. Additionally, a strong marketing ROI - earning five dollars for every dollar spent - is often viewed as a benchmark for success [6]. These ratios reassure buyers that the business is growing in a sustainable way, rather than relying on overly expensive acquisition strategies [14].
Optimization Strategies
To reduce PAC, it’s essential to track costs by acquisition channel. Social media, affiliates, and PPC campaigns often bring in players with varying levels of value [4]. Using AI to create personalized player experiences can increase conversion rates by 43%, while simplifying KYC and deposit processes can also help lower acquisition costs [9,32]. Aiming for a First-Time Depositor (FTD) conversion rate of 20%–30% ensures that registrations are effectively turning into depositors [6]. With mobile users projected to make up 70% of iGaming activity by 2025, prioritizing mobile-first experiences is becoming increasingly important [27]. Lowering PAC not only improves cash flow but also enhances your valuation metrics.
Buyer Perspective
Buyers closely evaluate how acquisition costs align with player value and recovery time to judge whether your spending is both predictable and scalable [9]. A PAC that exceeds LTV is a red flag, signaling potential issues with long-term profitability. By segmenting data based on player type and acquisition source, you can demonstrate that your marketing strategies are effectively targeting high-value players. This reassures buyers that your business is structured for ongoing profitability rather than relying on short-term tactics.
5. EBITDA and EBITDA Margins
Definition and Calculation Method
EBITDA, or Earnings Before Interest, Taxes, Depreciation, and Amortization, is a key metric that highlights core operating profitability. It’s calculated by adding back interest, taxes, depreciation, and amortization to net income. For a more accurate picture of sustainable earnings, businesses often use "normalized EBITDA", which excludes non-recurring or non-operational expenses.
In the iGaming M&A space, normalized EBITDA is particularly important. It adjusts for one-time costs or atypical expenses, offering a clearer view of consistent earnings. For instance, if an owner’s salary is above market rates, adjusting it to a standard level can significantly improve the normalized EBITDA figure.
Why It Matters for Valuation
EBITDA plays a critical role in standardizing earnings, making it easier to compare businesses within the same industry. This metric eliminates the impact of differences in capital structure, tax rates, and accounting practices, creating a "level playing field." As of July 15, 2025, the average EBITDA multiple for the Internet Gaming sector is 11.7, significantly higher than the 5.59 multiple for the broader Casinos & Gaming industry. Private companies often trade at around 4× EBITDA, while businesses with EBITDA exceeding $5 million tend to command multiples 1–2× higher [32].
Your EBITDA margin, which represents the percentage of revenue converted into EBITDA, is another critical factor. Margins above 10% are generally considered strong, while those exceeding 20% are viewed as exceptional [31]. Gabriel Sita, Founder of CasinosBroker, highlights its versatility:
"EBITDA serves multiple purposes, including business valuation, company comparison, and loan covenant establishment" [30].
However, Adrian-Alexandru Sfetcu from Legalbet cautions:
"EBITDA is a metric that is quite easy to manipulate, intentionally or unintentionally, by adjusting accounting practices or capitalizing certain expenses" [2].
Optimization Strategies
Before selling a business, it’s crucial to review financial records thoroughly. For example, capital expenditures mistakenly categorized as repairs or maintenance should be reclassified and added back to historic EBITDA. Similarly, related-party transactions, such as paying above-market rent for a shareholder-owned property, should be adjusted to reflect fair market value. Costs tied to non-essential or redundant assets - like unused properties or vehicles - should also be excluded.
Conducting an updated inventory count can uncover excess assets eligible for add-back. Additionally, negotiating better supplier terms or refining marketing strategies to improve customer acquisition efficiency can enhance margins. These steps not only optimize EBITDA but also demonstrate that your business generates reliable cash flow, which strengthens its overall financial health ahead of a sale.
Buyer Perspective
From a buyer’s standpoint, due diligence involves closely examining EBITDA adjustments to ensure they are genuinely non-recurring. While EBITDA often forms the foundation for valuation, buyers typically place greater emphasis on free cash flow, which accounts for future capital expenditures and working capital needs. A strong EBITDA margin - say, around 40% - signals operational efficiency but may also lead buyers to investigate whether such profitability is sustainable.
Presenting a clean, well-documented normalized EBITDA with transparent add-backs reassures buyers that your profitability is both genuine and repeatable. This clarity not only builds trust but also strengthens your position during negotiations.
6. Churn Rate and Player Retention
Definition and Calculation Method
Churn rate is a key metric for evaluating the health and sustainability of your iGaming platform, alongside metrics like ARPU (Average Revenue Per User) and LTV (Lifetime Value). It measures the percentage of players who leave your platform within a specific time frame - whether daily, monthly, or annually. The formula is straightforward: (Players at Start – Players at End) / Players at Start. Alternatively, you can calculate it as 100% minus the retention rate, where retention rate is (Active Players in Current Period / Active Players in Previous Period) × 100% [4][21][14].
A high churn rate often points to underlying issues such as player dissatisfaction, limited game options, poor user experience, or inadequate customer support [16][4][19]. In the iGaming world, churn analysis can also reveal patterns like "bonus hunters" - players who leave as soon as they fulfill wagering requirements. Such behaviors may signal weaknesses in your bonus strategies [16][34].
Nikolaj Plugatar, Business Development Manager at Slotegrator, explains: "A high churn rate can indicate player dissatisfaction, increased competition or enhanced performance by existing competitors, insufficient game offering, or other deficiencies" [16].
This metric doesn’t just measure player turnover; it also provides valuable insights into player loyalty and platform performance.
Why It Matters for Valuation
For potential buyers, churn rate is a critical measure of how sustainable your revenue streams are. For online casinos, a monthly churn rate below 5% is considered excellent, while a Monthly Active User (MAU) churn rate under 15% is a strong benchmark [4][35][6]. A high churn rate may indicate that your business is overly reliant on costly player acquisition rather than nurturing a stable, long-term player base [4][2].
The numbers make it clear: retaining an existing player is far more cost-effective than acquiring a new one. Existing players are also 50% more likely to try new games and spend 31% more compared to new players [27]. Low churn, therefore, directly boosts your platform’s valuation.
Buyers will also look for patterns in churn. For example, if churn spikes immediately after promotional periods, it could devalue your player database [16][34]. A strong 30-day retention rate of 70% to 80% shows that your platform has genuine "stickiness" and fosters brand loyalty [35][6]. Additionally, a reactivation rate of 20% or higher for dormant users through CRM campaigns is a strong indicator of effective engagement strategies [4].
Optimization Strategies
To improve churn and retention before selling your platform, consider these strategies:
- Loyalty and VIP Programs: Implement programs that reward long-term players and enhance their perceived value of your platform [16][34].
- Game Catalog Updates: Regularly introduce new releases to keep players engaged and excited [16].
- AI-Powered Recommendations: Use AI to suggest games based on player behavior, which can boost engagement by up to 39% [27][6].
- Proactive Churn Monitoring: Watch for early signs of churn, like reduced logins or declining engagement, and address them with personalized offers [33].
- Refined Bonus Structures: Replace one-off promotions with cashback offers or bonus chains to discourage bonus hunters [6].
- Targeted Communication: Use SMS marketing and personalized CRM campaigns to re-engage dormant players [16][4].
- Enhanced Support Metrics: Aim for a live chat First Response Time under 30 seconds and a First Contact Resolution rate of 70% to 80% [4].
These steps not only improve retention but also position your platform as a more attractive investment.
Buyer Perspective
Investors want platforms with stable, predictable revenue rather than those relying on expensive, high-risk acquisition strategies [2].
Najam Ahmed, Content Marketing Manager at Comm100, explains: "A rising churn rate means players are leaving faster than you can replace them. This can signal issues with game design, user experience, or customer support" [4].
Buyers will closely examine whether your efforts to reduce churn are long-term solutions or just temporary fixes. Providing clear data on churn rates, along with evidence of effective retention strategies - such as loyalty program results, reactivation campaign performance, and support quality metrics - demonstrates that your player base is engaged and your revenue streams are reliable. Transparency in this area builds buyer trust and strengthens your negotiation position.
sbb-itb-ba142f6
7. Gross Gaming Revenue (GGR) and Revenue Diversity
Definition and Calculation Method
Gross Gaming Revenue (GGR) represents the difference between total wagers (handle) and winnings paid out - essentially serving as the "sales" figure before any deductions are made [36][17][36][18].
How GGR is calculated depends on the gaming vertical. For sportsbooks and casino games, it’s simply the handle minus winnings. In poker, it’s based on rake (the fee taken from pots) and tournament entry fees. Meanwhile, bingo platforms calculate it as ticket sales minus prizes paid [14]. For most iGaming businesses, the GGR margin - the ratio of GGR to total wagers - typically hovers around 13–15%, reflecting the competitive payout percentages required in the market [36]. This metric lays the groundwork for understanding revenue streams and diversification.
"GGR provides a snapshot of the total revenue generated from gaming activities before any expenses are deducted." – Anton Shmerkin, Digital Creator specializing in iGaming, GR8 Tech [6]
Why It Matters for Valuation
GGR does more than just track sales - it reflects both the volume of activity and operational efficiency. For potential buyers, a steady 10–15% year-over-year increase in GGR signals strong growth [6]. However, raw GGR figures alone don’t tell the full story. Businesses with a diversified revenue base tend to command higher valuations. For instance, companies with a balanced portfolio across multiple verticals often achieve forward EBITDA multiples of around 13.8x, while those dependent on a single product may only reach around 4.7x [9].
Revenue concentration can be a red flag. If over 80% of revenue comes from one game or if 40% of GGR is generated by just 1% of players, it raises concerns about the stability of the business model [8][9].
"If 40% of your GGR comes from 1% of players, one churn event can wipe out forecasts" [8].
Buyers prefer companies with a diverse product mix - spanning casino, sportsbook, poker, and bingo - and strong cross-sell rates, which indicate that players are engaging with multiple offerings [14].
Optimization Strategies
Before putting your business on the market, focus on diversifying revenue streams and improving GGR efficiency. One key metric to track is the cross-sell rate, which measures the percentage of players active in more than one vertical [14]. Low-margin products, like lottery or instant games, can be used strategically to guide players toward higher-margin verticals [8].
Keep a close eye on the hold percentage (GGR/handle) to maintain healthy margins without alienating players [14]. Tools like anomaly detection can flag when VIP dependency becomes risky, while AI-based recommendation systems can encourage players to explore games with better profit margins [6][8].
Buyer Perspective
Investors pay close attention to metrics like turnover, GGR, and NGR. A rise in wagers without corresponding GGR growth could point to issues with margins or return-to-player (RTP) rates [8]. Stable and diverse revenue streams are far more attractive than models heavily reliant on one product or a small group of high-stakes players [8][9].
To appeal to buyers, document your product mix, cross-sell performance, and VIP concentration. This transparency demonstrates that your platform is capable of generating steady, long-term revenue, with multiple verticals supporting one another to reduce the risk of downturns in any single area [14].
Gambling.com Stock Analysis | Down 40%! | Is $GAMB Undervalued?
Current Market Benchmarks for iGaming Businesses
Understanding market benchmarks is crucial for setting realistic expectations when positioning your iGaming business for sale. The global online gambling market hit $95.5 billion in 2024, with projections suggesting it could grow to $257 billion by 2034 [37]. In the U.S., commercial gaming operators contributed $15.91 billion in direct gaming tax revenue in 2024, reflecting the strength of the U.S. regulatory framework [37]. These trends play a significant role in shaping valuation multiples and revenue forecasts.
Valuation multiples vary depending on the business model and profitability. In 2024, the average earnings multiple for technology and online businesses was 3.13x, while the average revenue multiple stood at 1.05x [7]. However, iGaming businesses with solid fundamentals often achieve higher multiples. For example, SaaS platforms and software providers in the top tier reached profit multiples up to 6.13x, while affiliate operations and content sites typically achieved profit multiples of 2.85x and revenue multiples around 2.80x [38].
| Business Type | Profit/EBITDA | Revenue/NGR | Primary Value Driver |
|---|---|---|---|
| SaaS / iGaming Software | Up to 6.13x | 3x–10x ARR | Player retention & recurring revenue |
| E-commerce / Retail Betting | 3.98x | 2.83x | Profitability focus |
| Affiliate / Content Sites | 2.85x | 2.80x | Traffic diversity & quality |
| Mobile Apps | 2.93x | 2.50x | User engagement levels |
Geography and regulation also heavily influence valuations. Businesses operating in well-regulated markets, such as established U.S. states or Colombia, tend to command premium multiples. In contrast, those in less stable or "grey" regulatory environments often face discounted valuations due to higher revenue risk [2][37]. Buyers are increasingly prioritizing profitability, favoring cash-generating businesses with sustainable unit economics [38].
"The real value of an asset, a company or anything is the price someone is ready to pay for it." – Pierric Blanchet, Founder, The Gambling Cockpit [39]
Size matters, too. Businesses earning over $1 million typically secure a 45% premium compared to those generating under $100,000 [38]. However, reliance on a single traffic source - exceeding 40% - often leads to valuation discounts. This became evident in early 2025 when content-based sites experienced a 37% drop in sales volume following changes in search algorithms [38]. These benchmarks highlight the importance of maintaining strong financial metrics to meet buyer expectations and position your business competitively in the market.
How to Prepare Your Business for Sale
Getting your iGaming business ready for sale means having thorough documentation and well-organized processes in place. Prospective buyers will expect detailed financial records covering the past three to five years, including Income Statements, Balance Sheets, and Cash Flow Statements [40][41]. With technology-based businesses spending an average of just 82 days on the market - far quicker than the broader market's 180-day average [7] - being prepared from the start is critical.
Start by organizing key financial data like your Chart of Accounts and player-specific metrics, such as Net Gaming Revenue (NGR), Player Acquisition Costs (PAC), and Lifetime Value (LTV). Alongside these, compile essential corporate records, including charter documents, organizational charts, security holder lists, litigation history, regulatory correspondence, gaming licenses, and compliance documentation. Buyers will also look for metrics like Know Your Customer (KYC) completion rates of 85–95% and Anti-Money Laundering (AML) alert rates between 0.1–1% [4][42]. These records and metrics form the backbone of the due diligence process.
"Due diligence is completed before a deal closes to provide the buyer with an assurance of what they're getting." – CFI Team [41]
Your regulatory standing can significantly impact the sale. Businesses operating in well-regulated jurisdictions often attract higher valuations, while those in less stable environments may face price reductions [2]. Ensure all licenses are current and prepare for potential license transfers by documenting capital requirements and compliance service level agreement (SLA) rates, aiming for 98–100% [4][42]. Engaging M&A advisors early can help identify any gaps and boost your market appeal. According to Curtis Kroeker, Group General Manager at BizBuySell.com, small businesses typically sell for about 87% of their original asking price [3]. Professional advice can help maximize your sale price.
Finally, consider using specialized platforms to simplify the process. Services like MyReadyMade provide expert advisory and support for license transfers across more than 50 jurisdictions. Whether you're dealing with Malta's capital requirements of $87,000–$109,000 or navigating Estonia's 2–3 month application timeline [42], these platforms can help ensure a smoother regulatory transition.
Conclusion
Focusing on the metrics outlined earlier can significantly strengthen buyer confidence in your platform's potential for steady growth. By honing in on key performance indicators like NGR, ARPU, LTV, PAC, EBITDA (and its margins), Churn, and GGR, you can position your iGaming business for a higher valuation.
Buyers often adopt a hybrid approach to assess a business's health and long-term viability [2]. As Rose Stabler, President of Certified Business Brokers, explains:
"A valuation is not about determining what a company is worth in the current owner's hands, it is about the company's transferable value" [43].
These metrics do more than just showcase financial performance; they also play a critical role in driving valuation multiples. For instance, a favorable LTV-to-PAC ratio signals profitable growth, while low churn rates and a diversified revenue base reduce the risks associated with ownership transfer [1][43].
To maximize your business's appeal, normalize EBITDA by eliminating personal expenses and one-off costs [44]. Diversify your player base and document operational procedures to demonstrate the business's ability to run independently [43]. These steps can make a substantial difference - potentially moving you from selling at the industry average of 87% of your asking price to securing a premium [3].
Additionally, strong regulatory compliance paired with sound financials ensures a smoother sale process. Platforms like MyReadyMade provide specialized M&A advisory services and license transfer support in over 50 jurisdictions. With online businesses selling in just 82 days on average - compared to 180 days for traditional businesses [7] - having robust metrics and well-prepared documentation can set you up for a quick and successful sale.
FAQs
How can I increase my iGaming business's Player Lifetime Value (LTV) before selling?
To grow your iGaming business's Player Lifetime Value (LTV) before selling, you need to focus on two key areas: increasing the revenue each player brings in and extending how long they stay active. LTV is calculated using this formula: Average Revenue Per User (ARPU) × Average Player Lifespan. So, any progress in these areas directly impacts your overall success.
Start by segmenting your player base to identify your most valuable groups. Then, leverage tools like predictive analytics or personalized offers to boost ARPU. For instance, offering tailored game recommendations, exclusive bonuses, or cross-sell opportunities can encourage players to spend more - all without significantly raising your acquisition costs. At the same time, focus on retention strategies to keep players engaged longer. Tactics like loyalty programs, tiered rewards, and personalized communication can reduce churn and build stronger connections with your audience. Don’t overlook the importance of a smooth user experience - fast load times, mobile-friendly platforms, and responsive customer support can make a big difference in keeping players around.
As your LTV improves, it becomes a powerful selling point for potential buyers. Platforms like MyReadyMade can help you highlight these gains and connect with serious buyers, increasing your business's overall valuation.
What do buyers look for in the EBITDA of an iGaming business?
When buyers look at EBITDA, they’re trying to gauge the business’s steady and reliable earnings potential. To do this, they make adjustments for things like one-time expenses, costs tied specifically to the owner, or other irregularities. The goal? To get a more accurate sense of the company's actual profitability.
On top of that, they dig into the free cash flow - taking into account capital expenditures, taxes, and interest payments. If there’s any hint of financial tampering, like earnings being artificially boosted, it can seriously undermine buyer trust and confidence.
Why does having a diversified revenue stream increase the value of an iGaming business?
A well-rounded revenue stream plays a key role in boosting the value of an iGaming business. Why? Because it spreads out risk and creates steadier, more predictable cash flow. By drawing income from various sources - whether through different games, regions, or customer groups - your business becomes less reliant on any single element. This makes it better equipped to handle shifts in the market.
This kind of stability is a big plus for potential buyers. It shows that your business is less exposed to vulnerabilities and has a better shot at long-term profitability. A diverse revenue strategy also signals that your company is ready to navigate and succeed in the competitive and unpredictable iGaming landscape.
Related Articles

Ultimate Guide to Earnout Negotiations in M&A
Structure and negotiate earnouts in regulated M&A with clear metrics, anti-manipulation covenants, and acceleration or escrow protections.

How to Draft M&A Definitive Agreements
Guide to drafting M&A definitive agreements covering deal structure, reps & warranties, indemnities, payment terms, and regulatory compliance.

How IP Affects Tokenization Valuation
How tokenizing patents, copyrights, and trademarks adds liquidity and market value—plus legal, regulatory, and valuation steps.
Looking to Buy or Sell?
Get in touch with our team for personalized assistance