Ultimate Guide to Tokenized Asset Valuation
Ultimate Guide to Tokenized Asset Valuation
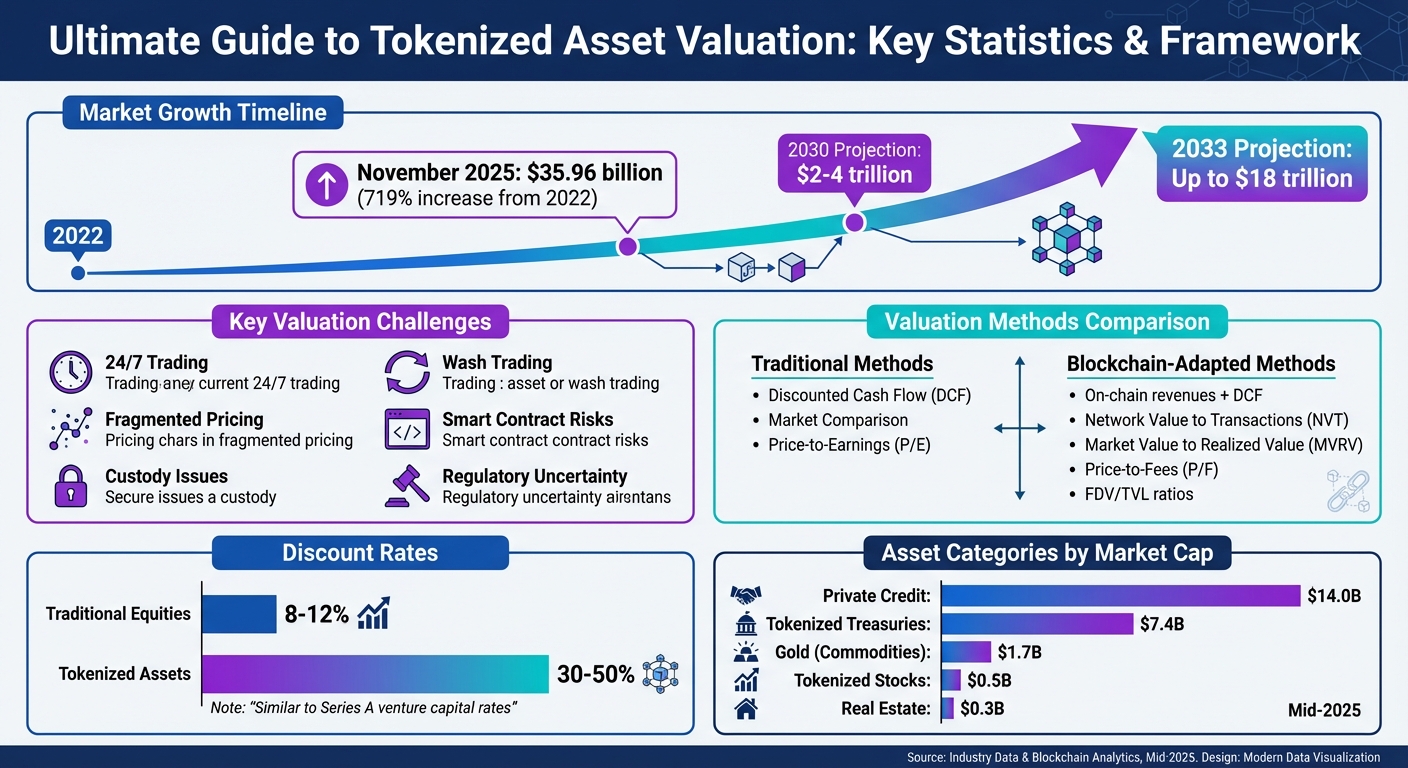
Tokenized assets are digital tokens on blockchains that represent ownership of physical or financial assets like real estate, debt, and securities. They’ve grown rapidly, with the market reaching $35.96 billion in November 2025, a 719% increase since 2022. Analysts predict growth to $2–$4 trillion by 2030, and up to $18 trillion by 2033.
Valuing tokenized assets is complex due to factors like 24/7 trading, fragmented pricing, and unique blockchain risks (e.g., custody issues, wash trading). Traditional valuation methods like Discounted Cash Flow (DCF) and Market Comparison now require adjustments to include blockchain-specific metrics like on-chain revenues, Total Value Locked (TVL), and tokenomics.
Key insights:
- Fractional Ownership: Tokenization allows smaller investors to own portions of traditionally illiquid assets.
- Valuation Methods: Incorporate blockchain metrics like Network Value to Transactions (NVT) and Market Value to Realized Value (MVRV).
- Challenges: Liquidity, smart contract risks, and regulatory uncertainty complicate fair valuation.
- Tools: Platforms like Nansen and Token Terminal provide on-chain data for better analysis.
As institutional adoption grows, businesses and investors must adapt to these new frameworks to evaluate tokenized assets accurately.
Token valuation - Is it possible to calculate???
Adapting Standard Valuation Methods for Tokenized Assets
Traditional valuation methods, originally designed for stocks, bonds, and real estate, need adjustments to work effectively with tokenized assets. The challenge lies in accounting for on-chain revenue streams, high volatility, and smart contract risks - factors unique to blockchain ecosystems. While the core principles of valuation remain intact, the inputs and risk assumptions must be tailored to reflect the decentralized nature of these assets. These changes pave the way for more blockchain-specific approaches to valuation.
Discounted Cash Flow (DCF) Analysis for Tokens
DCF analysis, a widely used method for determining intrinsic value, requires a redefinition of "cash flow" when applied to tokenized assets. Instead of traditional quarterly earnings, analysts focus on on-chain revenues such as transaction fees, staking rewards, and protocol fees. For instance, Ethereum validators earned approximately $282.6 million in net transaction fees during Q1 2025, while Solana validators collected $984.86 million in fees during the same period - 21% of Solana's total revenue compared to Ethereum's ~9% [6].
The discount rates for tokenized assets are significantly higher than those used for traditional equities, reflecting factors like technological uncertainty, regulatory risks, and market volatility. Rates between 30% and 50% - similar to those used in Series A venture capital - are common [3]. In June 2018, John Todaro and Blocktown Capital applied a 40% discount rate to a DCF analysis of the Republic Protocol (REN) token. By treating node trading fees as "Ether flow" and using a 2% terminal growth rate, they calculated a fair value of $9.05 per REN token, based on a total network cash value of $4.7 billion and 519 million circulating tokens [3].
"A dollar next year is not worth the same as a dollar today. One key point to note, is that all expected cash flows are not treated equally. We must build in a risk measure."
– John Todaro, Blocktown Capital [3]
For tokens with vesting schedules, analysts often apply a Discount for Lack of Marketability (DLOM) to account for reduced liquidity. This adjustment highlights the need to recalibrate all valuation methods, including comparisons and models for asset-backed tokens.
Market Comparison Methods
Market comparison methods, often referred to as "pricing", estimate an asset's value based on what others are paying for similar assets rather than intrinsic cash flows [6]. However, effective comparisons require sector-specific analysis: for example, comparing oracle services with other oracles or Layer-1 blockchains with their peers [5]. Traditional metrics like Price-to-Earnings (P/E) are replaced by crypto-specific ratios such as Price-to-Fees (P/F), Fully Diluted Value to Total Value Locked (FDV/TVL), and Market Cap to Total Addressable Market (TAM).
In March 2025, 21Shares compared Solana to Ethereum, using Ethereum as a benchmark. At the time, Solana’s price of $124.87 represented 29.3% of Ethereum’s market capitalization. The analysis suggested that if Solana were to achieve parity with Ethereum’s market cap, its price could rise to $426.45 [6]. Similarly, 21Shares used a market-sizing approach to evaluate Bitcoin, projecting that if Bitcoin captured 25% of gold’s $21.805 trillion market cap, its price would reach $274,758 [6].
A key challenge with these methods is reflexivity: the value of native tokens often ties directly to their market price [6]. Tokenomics factors, such as emission schedules and circulating supply, also play a role. For instance, a token with 90% of its supply already unlocked faces less future selling pressure than one with high upcoming emissions [5].
"Relative valuation methods, also called 'pricing,' estimate how much to pay for an asset based on what others are paying for comparable ones."
– 21Shares [6]
When using Total Value Locked (TVL) as a metric, it’s crucial to determine whether the liquidity is "rented" (driven by temporary incentives) or stems from organic demand. High TVL driven by short-term rewards can distort valuations and may vanish once incentives end. Such nuances underscore the need for more refined models when valuing tokenized assets.
Valuing Asset-Backed Tokens
Asset-backed tokens, tied to physical assets like real estate, commodities, or debt, often deviate in market performance due to on-chain factors such as trading friction, bid-ask spreads, and liquidity differences across jurisdictions [7][2]. Accurate valuation requires more than multiplying the asset’s market price by its quantity (P×Q). Analysts must also consider market depth, liquidity profiles, and execution realities [7].
Large token sales can lead to significant slippage because of thin order books. To address this, valuators model "slippage curves" using historical trade data to estimate the realized price [7]. For over-the-counter (OTC) block sales, relying solely on exchange price feeds like CoinGecko is insufficient; volume modeling and bid data are necessary to apply appropriate discounts [7].
Tokens with smart contract restrictions - such as multisig or DAO governance locks - require a marketability discount, similar to restricted stocks in private equity [7][8]. Additional factors, like the token’s legal classification (e.g., security status) and enforceability of claims against the underlying asset in case of platform failure, must also be considered [8].
In March 2025, 21Shares conducted a DCF analysis on Ethereum, calculating its intrinsic value using an annualized cash flow of $2.869 billion (from transaction fees and token issuance) and a discount rate of 11.02% based on historical returns of the Invesco QQQ Trust ETF. The analysis resulted in an implied price of $7,249 per ETH, a 297% increase over its market price of $1,824 [6].
"This guide provides a framework for investment professionals to undertake a thorough analysis of the valuation drivers of cryptoassets, including fundamental characteristics such as cash flows, growth rates, and tokenomics. Current valuation models have their limitations, and the lack of historical data make statistically robust cryptoasset valuations challenging."
– Rhodri Preece, CFA, Senior Head of Research, CFA Institute [4]
Blockchain-Specific Valuation Metrics
Blockchain valuation metrics go beyond traditional methods by focusing on the unique aspects of blockchain networks, such as token utility, on-chain activity, and network performance. These metrics provide deeper insights into whether a token's price reflects actual use or is driven by speculation.
Network Value to Transactions (NVT) Ratio
The NVT ratio is calculated by dividing a token's market capitalization by its daily transaction volume. Think of it as the crypto equivalent of the price-to-earnings (P/E) ratio. To refine this metric, some analysts use the "Free Float NVT", which excludes locked tokens, offering a clearer view of circulating supply versus network activity [9].
"NVT can be thought of as a rough P/E (price to earnings) ratio proxy for crypto assets."
– Coin Metrics [9]
However, the NVT ratio has its limitations. For instance, declining on-chain activity due to increased trading on centralized exchanges, derivatives markets, or Layer-2 solutions like the Lightning Network can skew the metric. While NVT is useful for assessing on-chain utility, other tools like the MVRV ratio offer a broader perspective on market sentiment.
Market Value to Realized Value (MVRV) Ratio
The MVRV ratio compares a token's market capitalization to its realized capitalization, which represents the aggregate cost basis of coins based on their last transaction price [10][11][13]. Market Value is calculated as the current price multiplied by the circulating supply, while Realized Value reflects the "book value" of the network. A high MVRV suggests significant unrealized gains, while a low MVRV points to unrealized losses.
Historically, Bitcoin has spent only 15% of its time with an MVRV below 1.0 and just 6% above 3.2 [12]. For example, when Bitcoin hit $40,000 on January 8, 2021, the Spent Output Profit Ratio (SOPR) reached 1.048, signaling that holders were locking in gains before the price later dropped to $32,600 [9].
| MVRV Ratio Value | Market Interpretation | Typical Investor Action |
|---|---|---|
| > 3.7 | Extreme Overvaluation / Market Top | Selling positions [13][14] |
| 1.0 to 3.5 | Fair Value to Growth Phase | Holding and observing trends [12][14] |
| < 1.0 | Undervaluation / Market Bottom | Accumulating or taking long positions [13][14] |
That said, MVRV isn't perfect. Lost private keys can inflate Realized Value, and non-speculative transfers, such as moving tokens to collateral vaults, can affect the metric without reflecting true cost bases. Despite these nuances, MVRV remains a valuable tool for identifying market extremes and gauging overall sentiment.
"MVRV is not a crystal ball but a lens for understanding Bitcoin's fundamentals. As Bitcoin evolves, so must our approach to its valuation."
– Peter Chung and Jaehyun Ha, Presto Research [12]
Together, NVT and MVRV provide complementary insights into network activity and market behavior, paving the way for deeper analysis of token supply dynamics.
Token Supply and Scarcity Analysis
Token supply plays a central role in determining a blockchain asset's scarcity and long-term value. Factors like issuance schedules, inflation rates, and the balance between circulating and locked supply all contribute to this dynamic [15]. For Proof-of-Work (PoW) tokens like Bitcoin, scarcity is built into the system through mechanisms like the halving, which reduces issuance by 50% every 210,000 blocks [15]. As of March 31, 2025, the global average cost to mine one Bitcoin stood at $97,964, acting as both an economic and psychological price floor [6].
Proof-of-Stake (PoS) tokens have distinct supply characteristics. Staking reduces circulating supply as tokens are locked to secure the network and earn rewards. For example, Ethereum's annualized issuance for Q1 2025 was $2.586 billion, while Solana validators earned $984.86 million in transaction fees during the same period [6]. These metrics enable valuation models like Discounted Cash Flow, treating staking rewards and fees as dividends and positioning PoS tokens as capital assets.
On-chain analysis also helps investors monitor supply distribution and detect concentrations of "whales" that could impact liquidity and price stability [15]. Tokens with high upcoming unlocks may face selling pressure, while those with 90% of their supply already circulating pose less dilution risk. This level of transparency provides a clearer picture of scarcity compared to traditional assets, where supply data is often opaque.
"When the BTC price is below the total cost of mining one BTC, it signals that Bitcoin miners may be struggling and potentially taking short-term losses."
– 21Shares [6]
Specific Challenges in Tokenized Asset Valuation
Valuing tokenized assets comes with its own set of hurdles, requiring traditional methods to adapt to blockchain-specific complexities. Here's a closer look at some of the key challenges.
Liquidity and Trading Volume Issues
Unlike stocks traded on centralized exchanges with consistent pricing and high liquidity, tokenized assets are scattered across various platforms such as decentralized exchanges, custodial venues, and informal over-the-counter markets. This fragmented trading environment hampers price discovery and often results in lower trading volumes.
For instance, as of mid-2025, BlackRock's BUIDL fund reported a monthly transfer volume of $1.8 billion. Yet, the fund’s holder base consisted of just 85 addresses, reflecting an institutional buy-and-hold strategy with minimal secondary market activity. Similarly, a study of 58 residential property tokens on the RealT platform revealed that ownership changed hands only once a year on average due to legal and compliance barriers [16].
"Fractionalization alone is insufficient to ensure liquidity; without appropriate infrastructure and legal design, tokenized assets may continue to behave like their illiquid off‑chain counterparts."
– Swinkels [16]
Adding to the complexity, wash trading - where artificial volumes are generated - further skews the perception of market liquidity. For assets with restrictions like lock-up periods or vesting schedules, analysts often apply a Discount for Lack of Marketability (DLOM) using models such as Ghaidarov or Black-Scholes to adjust for limited tradability [1]. Identifying the "principal market" with the highest activity is also essential for adhering to standards like ASC 820 and IFRS 13 [1].
| Asset Category | Market Cap (USD bn) | Secondary Market | Liquidity | Transferability |
|---|---|---|---|---|
| Private Credit | $14.0 | Partial | Low | Whitelisted |
| Tokenized Treasuries | $7.4 | Partial | Medium | Whitelisted |
| Gold (Commodities) | $1.7 | Yes | High | Open |
| Tokenized Stocks | $0.5 | Partial | Low | Whitelisted |
| Real Estate | $0.3 | Partial | Low | Whitelisted |
Source: RWA.xyz data as of mid-2025 [16]
These liquidity limitations tie directly to concerns about technology and custody risks.
Smart Contract and Custody Risks
While blockchain technology offers transparency, it also introduces unique risks. Smart contracts, which automate transactions, are not immune to bugs, vulnerabilities, or flawed logic. Unlike traditional custodial setups with insurance and regulatory backing, tokenized assets often depend solely on smart contracts. This reliance on code can lead to failures, making it harder to determine fair value [17].
"The valuation infrastructure in the current legal, accounting, technology, and back‑office framework, in combination with the immaturity of the digital asset market, create an environment of digital asset valuation uncertainty."
– Wulf A. Kaal, Samuel R. Evans & Hayley A. Howe [17]
Decentralized exchanges also pose higher custody risks and are more prone to price manipulation, which can distort the "exit price" used in valuations [17]. Analysts must assess the technical features of tokenized assets, including the blockchain they operate on, token standards (e.g., ERC-20 vs. ERC-721), and total supply. However, pricing data from lightly regulated markets should be approached with caution due to its unreliability.
These technical risks highlight the importance of legal and regulatory frameworks, which are discussed next.
Regulatory and Legal Compliance Factors
The legal landscape for tokenized assets is still developing, leading to significant valuation challenges [17]. Regulatory requirements vary widely across jurisdictions, and sudden changes in rules can create further uncertainty. In streamlined systems, like those governing government bonds, valuation models tend to be more predictable, but fragmented regulatory environments complicate tokenization [18].
To ensure compliance, regulations like KYC (Know Your Customer), AML (Anti-Money Laundering), and sanctions monitoring need to be integrated directly into smart contracts. This is why many institutional tokenized assets use "permissioned" structures on public blockchains, limiting trading to verified participants [18].
For example, in April 2021, the European Investment Bank issued a €100 million two-year digital bond on Ethereum. Managed by Société Générale-Forge, the project utilized the Compliant Architecture for Security Tokens (CAST) framework to embed KYC/AML protocols within the smart contract. The bond matured successfully in April 2023. Similarly, Banco Santander issued a $20 million one-year bond on Ethereum in 2019, featuring a custom smart contract for delivery-versus-payment settlement. The bond was redeemed early after just one quarter [18].
"Chainlink is setting a new standard for bringing utility, security, and transparency to tokenized assets, supporting asset managers looking to future‑proof their strategy for the growing tokenization market."
– Eliézer Ndinga, VP, Head of Strategy and BD, Digital Assets, 21Shares [2]
To navigate these challenges, businesses should implement multi-role permissioning in smart contracts, assigning roles like Issuer, Registrar, and Settler to maintain control and compliance. Publishing verified source code on platforms like Etherscan can enhance transparency and facilitate audits [18]. For companies in high-risk sectors - such as cryptocurrency, Forex, and Fintech - compliance measures are especially critical. Platforms like MyReadyMade provide expert advisory services for navigating regulatory complexities and license transfers across multiple jurisdictions.
Tools and Methods for Valuing Tokenized Assets
Valuing tokenized assets effectively requires the right tools and a structured approach. Here's how you can tackle this process in practical business scenarios.
Using On-Chain Data for Valuation
Blockchain analytics platforms offer unique insights into transaction trends, holder distribution, and network activity. For instance, Nansen excels in monitoring "Smart Money" by identifying prominent holders like institutional funds. A real-world example: Between July 2023 and February 2024, Nansen users saw Arthur Hayes acquire 500,000 PENDLE tokens in just 30 days, while Spartan Group transferred tokens to Binance - early signals of institutional interest that preceded significant price movements [20].
Platforms like Token Terminal bring a financial lens to blockchain data, translating it into familiar metrics such as revenue, price-to-sales ratios, and fees. This allows users to analyze decentralized applications and blockchains much like traditional businesses [21]. For tokenized real-world assets, RWA.xyz has become a key resource, tracking issuers, tokenized treasuries, and private credit. Institutions like JP Morgan, BlackRock, and even the US Treasury rely on its data [22].
Chainalysis categorizes blockchain addresses into identifiable wallets - exchanges, funds, or even illicit entities - helping users assess market composition and risk distribution [19]. Meanwhile, CoinMarketCap DexScan tracks on-chain trading pairs, whale movements, and token holder counts across decentralized exchanges. Blockchain explorers like Etherscan, BscScan, and SolScan provide real-time transaction histories and active address monitoring for Ethereum, BNB Chain, and Solana, respectively [23].
"The study of on‑chain fundamentals often focuses on measuring the intrinsic value of a cryptoasset using data derived directly from the blockchain."
– Christine Kim, Vice President, Research, Galaxy [15]
For example, investors analyzing Blast Layer‑2 used Nansen's dashboards to track Total Value Locked (TVL) in its staking contract. By identifying "Smart Money" among depositors, they assessed institutional confidence in the project's growth [20]. This level of transparency - tracking every transaction and balance - is unmatched by traditional asset systems [19].
Choosing Platforms for Tokenized Asset Transactions
Once you've gathered on-chain data, selecting a trusted platform is critical for secure transactions and accurate valuations. The right platform bridges traditional finance with blockchain tech, offering verified listings and expert guidance [2].
Take MyReadyMade, for instance. It provides a marketplace for high-risk and regulated industries, featuring verified listings, confidential transactions, and expert M&A services. Supporting license transfers across 50+ jurisdictions, it addresses gaps that have slowed the adoption of tokenized assets.
Before diving into valuations, evaluate an asset's health across three key areas: Distribution (ownership concentration), Liquidity (trading volume and activity), and Market Composition (types of holders). Platforms offering these insights help you avoid risks like wash trading or over-concentration by a few entities [19].
Combining Financial and Blockchain Metrics
To complete the valuation framework, integrate traditional financial metrics with blockchain analytics. Start by defining the token's technical features and identifying its primary pricing market - the one with the highest volume and activity, as specified by ASC 820 and IFRS 13 [1]. Then, calculate the exit price, factor in illiquidity discounts, and use appropriate models to quantify volatility [1].
Metrics like Market Capitalization and Fully Diluted Value (FDV) should be paired with blockchain-specific data like Total Value Locked (TVL) to measure the value of every dollar locked in a protocol [5]. On-chain metrics like the Network Value to Transactions (NVT) Ratio help determine whether a token's price reflects real network utility or speculative overpricing [15]. For example, Bitcoin’s average block interval has been 563 seconds since 2010 - about 6% faster than its 10-minute target - resulting in faster issuance that impacts valuation [15].
Token Terminal even offers Excel and Google Sheets integrations, enabling users to incorporate on-chain revenue and fee data into traditional valuation models [21]. When comparing assets, ensure you're matching similar protocols - Layer-1 blockchains with other Layer-1s, or oracle services with similar solutions [5]. Verify claims in a token's whitepaper by cross-referencing blockchain data, such as its supply schedule and inflation rate [15]. For highly volatile tokens (above 150%), consider replacing standard Black-Scholes models with alternatives like Ghaidarov’s framework, which better handles multi-period illiquidity and staggered vesting [1].
| Metric Category | Traditional Equivalent | Blockchain-Specific Metric | Purpose of Combination |
|---|---|---|---|
| Value/Utility | P/E Ratio | NVT Ratio | Compares market cap to network utility [15] |
| Market Health | Book Value | MVRV Ratio | Identifies market tops and bottoms [15] |
| Liquidity | Trading Volume | On-Chain Transfer Volume | Differentiates speculation from real asset movement [19] |
| Supply Risk | Shares Outstanding | Fully Diluted Value | Evaluates future selling pressure [5] |
Understanding the asset's consensus and security model is essential, as on-chain metrics are built on these foundations [15]. Be cautious of wash trading, where artificial volume is created to meet exchange requirements - this can distort valuations and exit prices [1]. By blending traditional and blockchain-focused methods, you’ll develop a more complete view of an asset's true worth.
Conclusion: What's Next for Tokenized Asset Valuation
The tokenized asset market is rapidly evolving, entering a phase where billions are locked in on-chain applications and blockchain settlement is reshaping the $1 trillion global payment market [2]. As digital assets become a more integral part of the global financial system, institutional investors are demanding valuation standards that match the rigor of traditional finance. This is especially important as client interest in tokenized real-world assets continues to grow [2].
Valuation methods must now address complexities like illiquidity risks and staggered vesting schedules while adhering to ASC 820 and IFRS 13 standards. These frameworks require regulated industries to pinpoint principal markets and determine exit prices for accurate financial reporting. With instruments like Simple Agreements for Future Tokens (SAFTs) and vested tokens gaining traction, valuation models also need to account for risks such as wash trading and price manipulation [1].
As compliance standards become stricter, bridging infrastructure gaps becomes a priority. Emerging platforms are addressing these challenges to support secure transactions in industries like iGaming, Cryptocurrency, Forex, and Fintech. For example, MyReadyMade offers services like verified listings, NDA-protected communications, and M&A advisory, including license transfer support across more than 50 jurisdictions.
"Tokenization offers asset managers significant opportunities, but its broader adoption has been historically constrained by the lack of high-quality infrastructure capable of addressing the technological challenges associated with integrating the technology with traditional capital markets."
– Eliézer Ndinga, VP, Head of Strategy and BD, Digital Assets, 21Shares [2]
The future of tokenized asset valuation lies in merging insights from traditional finance with blockchain technology. This involves using blockchain-derived KPIs to monitor project health in real time, applying multi-period illiquidity models like Ghaidarov for highly volatile tokens, and maintaining consistent valuation timing - such as 5:00 p.m. EST - to align with the 24/7 nature of digital asset trading [1]. With countries like the United Kingdom moving toward practical implementation, the integration of traditional and digital assets is accelerating [2].
FAQs
How do I value a token that has fees, staking, and inflation?
To determine the value of a token that includes fees, staking, and inflation, it's important to examine how each of these elements influences its underlying worth and overall supply.
Fees: Look into how the token's fee structure generates revenue. This could involve transaction fees or other mechanisms that contribute to the token's utility and profitability.
Staking Rewards: Assess the impact of staking on supply and demand. Staking often incentivizes holders to lock up their tokens, potentially reducing circulating supply and increasing demand.
Inflation Models: Evaluate how new token issuance (inflation) affects scarcity. A high inflation rate might dilute value, while a controlled issuance can maintain or enhance scarcity.
To bring these factors together, you can apply valuation methods like discounted cash flow (DCF) to estimate future revenue or use relative valuation to compare the token with similar assets. Combining these approaches offers a holistic view of the token's worth.
Which on-chain metrics matter most for valuation (NVT, MVRV, TVL)?
When it comes to evaluating tokenized assets, two important metrics often come into play: Market Value to Realized Value (MVRV) and Total Value Locked (TVL).
MVRV: This metric helps identify whether an asset might be overvalued or undervalued by comparing its market cap (current market price multiplied by circulating supply) to its realized cap (the value based on the price at which each token was last moved). It offers a snapshot of market sentiment and potential price trends.
TVL: Total Value Locked represents the combined value of assets locked within DeFi protocols. While it’s a popular metric for gauging the health and usage of decentralized finance platforms, it’s worth noting that different methods of calculation exist, and there’s no universal standard, which can sometimes lead to inconsistencies in interpretation.
Both MVRV and TVL are essential tools for gaining deeper insights into the valuation of tokenized assets, though each comes with its own nuances and limitations.
How should I adjust valuation for illiquidity, vesting, and lockups?
Adjusting valuation for illiquidity, vesting, and lockups means factoring in how these elements affect an asset's fair market value. Illiquidity discounts account for the challenge of converting assets into cash, particularly during lock-up periods or when trading is restricted. Similarly, vesting schedules and lockups delay when tokens become available, often requiring a reduction in their valuation. To ensure the fair value estimate is accurate and credible, these adjustments should be backed by market data, comparisons to similar transactions, or expert analysis.
Related Articles
KYC vs. AML for Payment Processors: What to Know
KYC confirms identity at onboarding, but only continuous AML monitoring stops payment processors from becoming conduits for financial crime.

Checklist for Secure Player Database Transfers
Step-by-step checklist for secure player database transfers: compliance, encryption, vendor vetting, zero-trust, integrity checks, and audits.
Ultimate Guide to Payment Compliance in iGaming
Roadmap for building compliant iGaming payment systems: AML/KYC, PCI‑DSS, multi‑PSP setup, chargeback controls and jurisdictional risks.
Looking to Buy or Sell?
Get in touch with our team for personalized assistance